Our new chart builder experience is here! Creating custom visualizations is now easier than ever. Choose your chart type, apply filters, and save your visualizations for quick access to the views that matter most to you. It’s all about helping you uncover insights faster and more effortlessly.
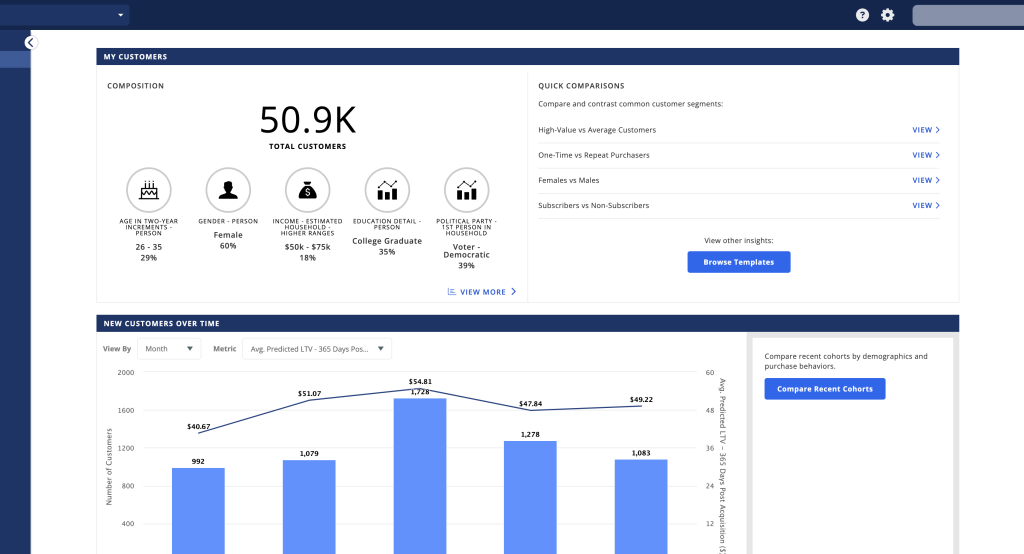
Visualization-Focused Design – See insights faster with your charts front and center. No distractions, just data that matters!
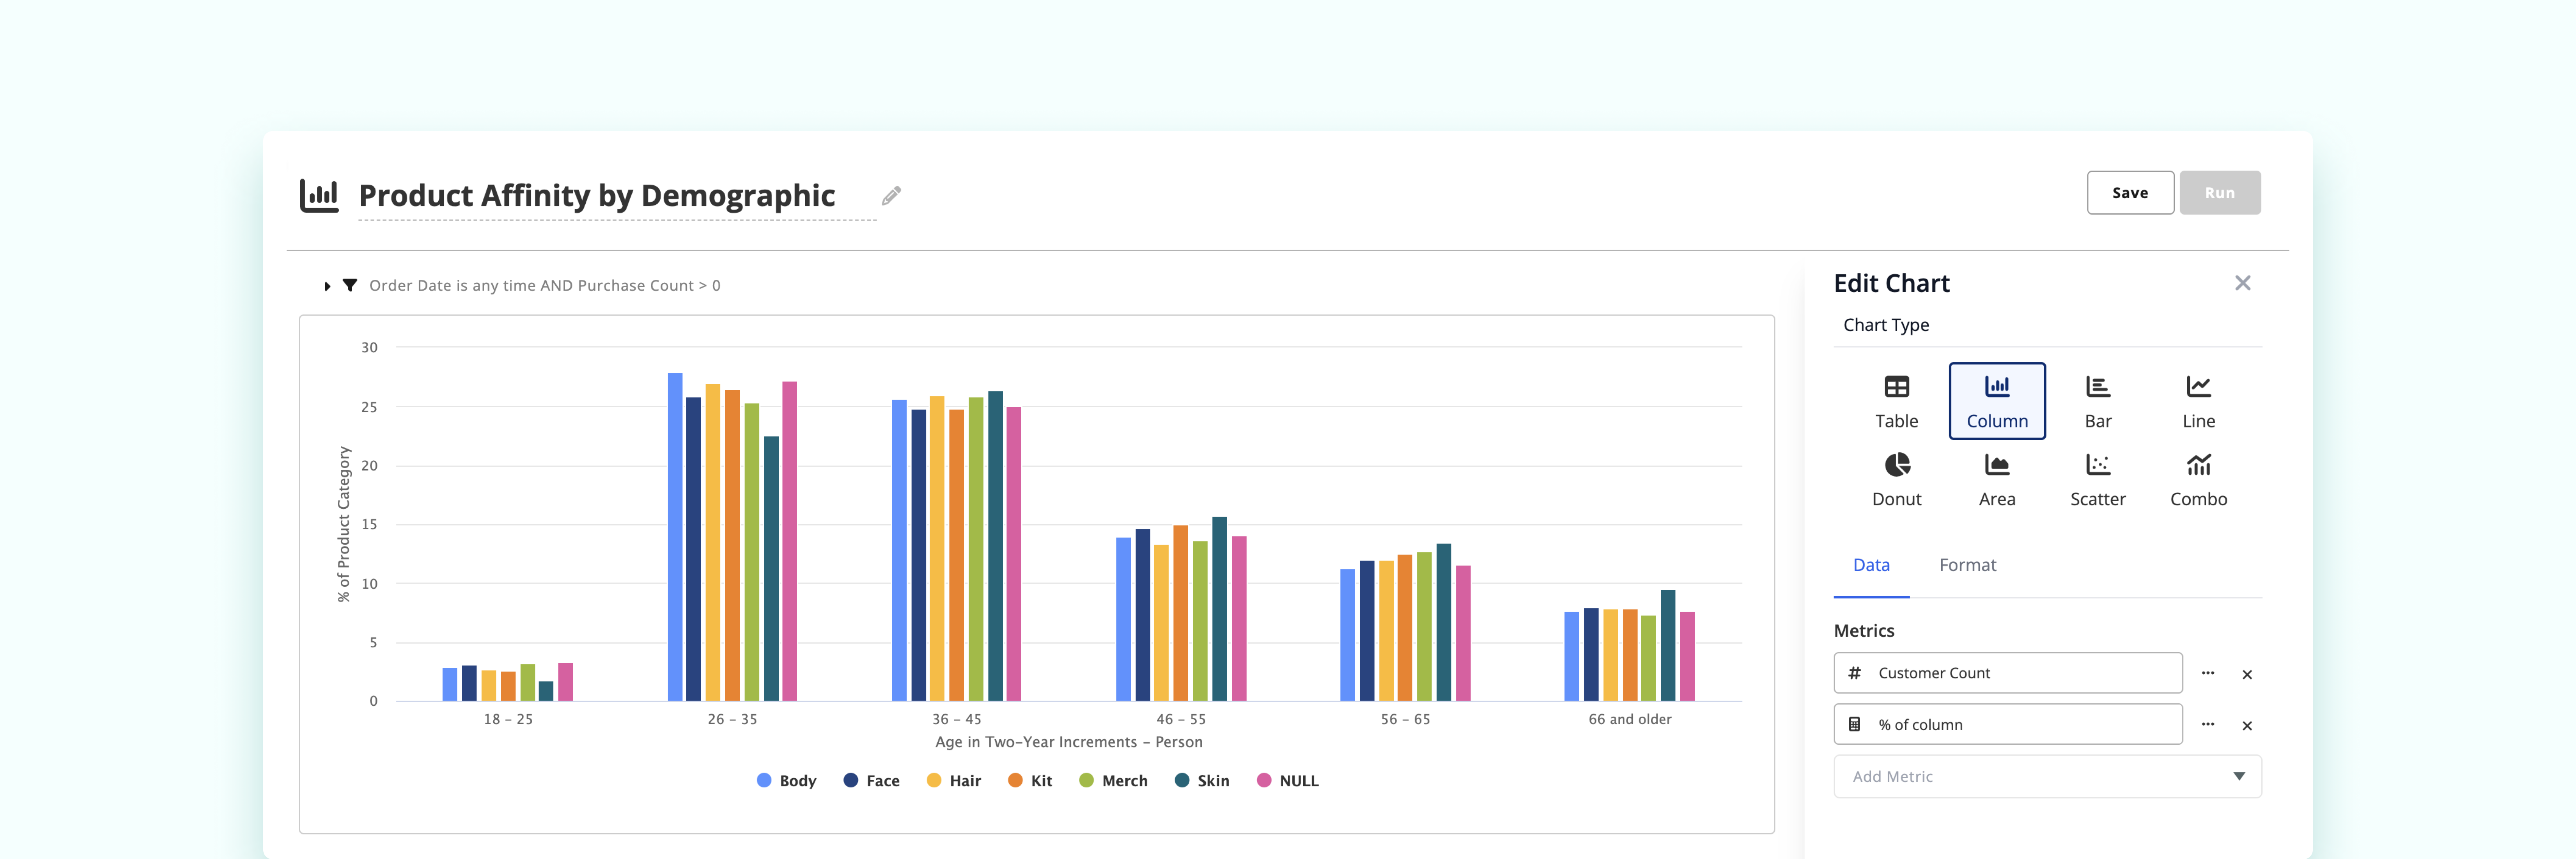
Effortless Controls – Our consolidated editor panel lets you select and tweak metrics and dimensions with ease.
Seamless Filtering – Apply filters directly to your charts without the need to set up an audience first. Explore and pivot data instantly, your way.
New Post-Acquisition Performance Templates
To help you get started faster, we’ve added three new chart templates focused on understanding customer performance post-acquisition. These are designed to surface insights quickly, so you can spend less time building and more time analyzing.
Post-Acquisition Performance by Product – See how different products influence customer lifetime value and repeat purchases.
Post-Acquisition Performance by Demographic – Analyze performance based on customer demographics to uncover key audience segments.
Post-Acquisition Performance by UTM – Track how different marketing sources impact customer behavior after acquisition.
Design & Color Refresh
We’ve also give the app a fresh look with updated colors and clean design to make your experience smoother and more enjoyable.