As we dive into an uncertain Q2, you may be wondering how your first quarter metrics compare to industry averages. Compare your performance and prepare for Q2.
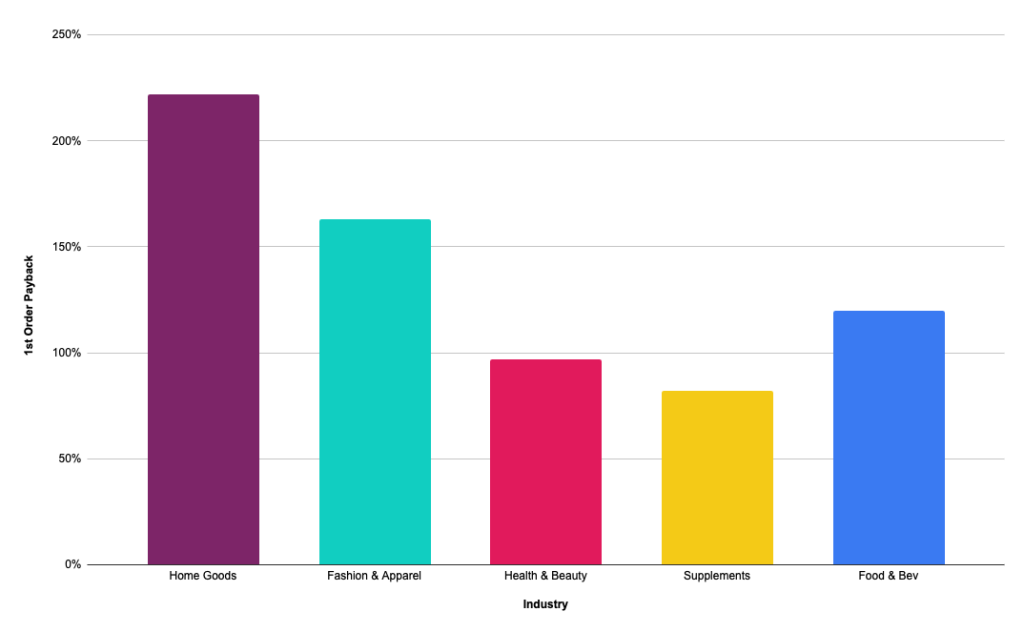
1st Order Payback
The percentage of customer acquisition costs that have been paid back by the first order.
Home Goods: 218% Fashion & Apparel: 162% Health & Beauty: 94% Supplements: 82% Food & Beverage: 122%
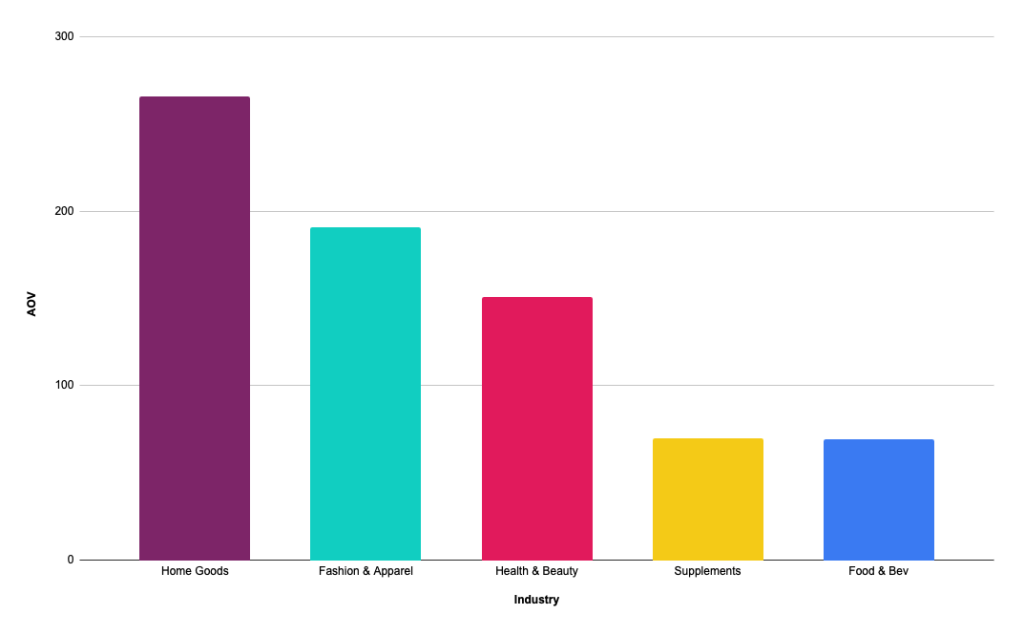
AOV
Average order value for orders placed in Q1 2025.
Home Goods: $266 Fashion & Apparel: $191 Health & Beauty: $151 Supplements: $70 Food & Beverage: $69
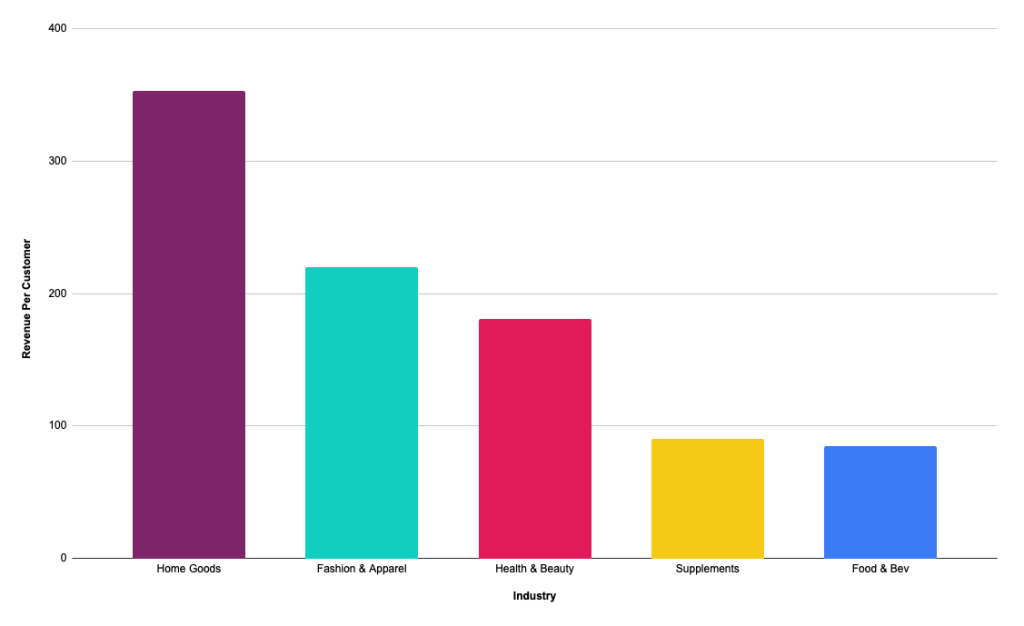
Revenue Per Customer
Revenue per customer is measured as total revenue / total customers who purchased within Q1.
Home Goods: $353 Fashion & Apparel: $220 Health & Beauty: $181 Supplements: $90 Food & Beverage: $85
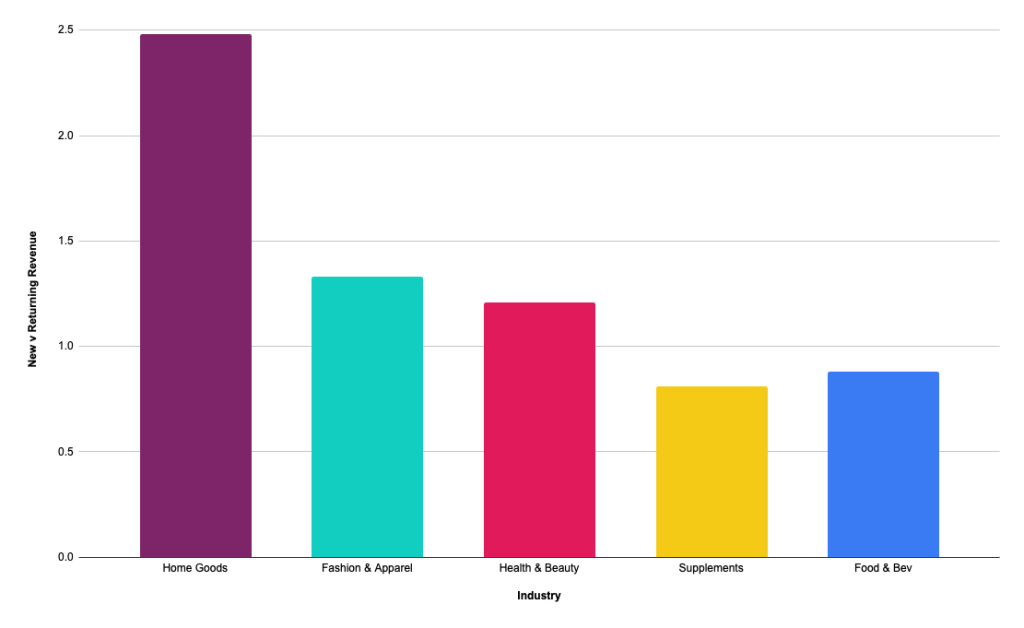
New v. Returning Ratio
>1 means that there are more new than returning customers during this period.
Home Goods: 2.48 (more new customers) Fashion & Apparel: 1.33 (more new customers) Health & Beauty: 1.21 (more new customers) Supplements: 0.81 (more returning customers) Food & Beverage: 0.88 (more returning customers)
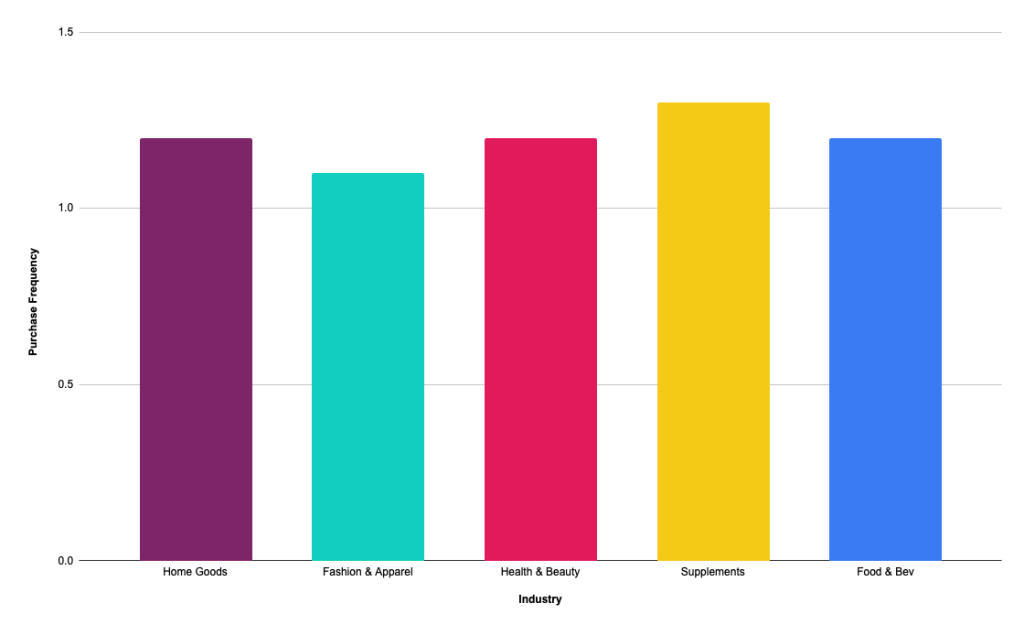
Purchase Frequency
Measured as total orders / total customers who purchased in Q1.
Home Goods: 1.2 Fashion & Apparel: 1.1 Health & Beauty: 1.2 Supplements: 1.3 Food & Beverage: 1.2