We’re excited to release our Q3 analysis! Results have been derived from a sampling of Decile clients, and averaged by industry.
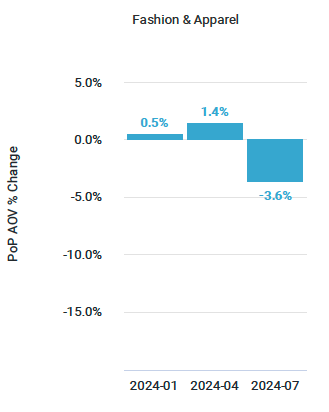
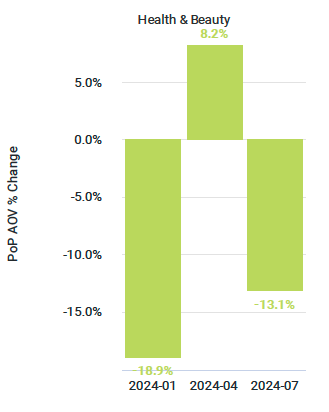
Average Order Value - % Change
Average order value is measured as Total Revenue / Total Orders per period, and changes compared quarter over quarter.
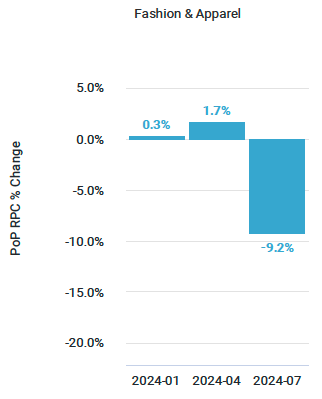
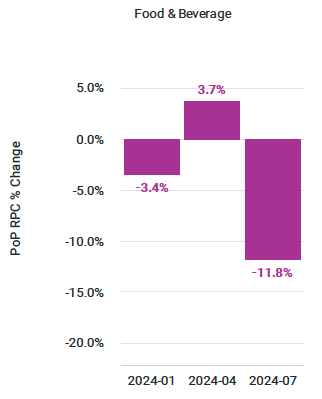
Revenue Per Customer - % Change
Revenue per customer is measured as Total Revenue/Total Customers, and changes compared quarter over quarter.
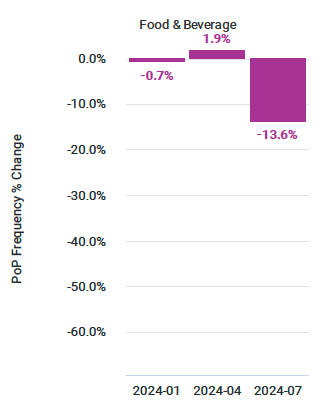
Purchase Frequency - % Change
Purchase Frequency is measured as Total Orders/Total Customers per period, and changes compared quarter over quarter.
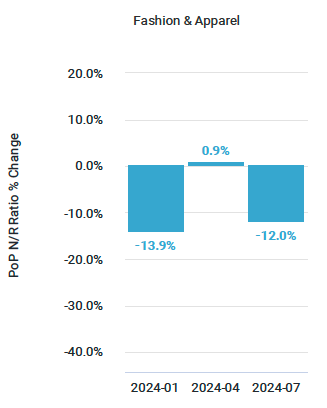
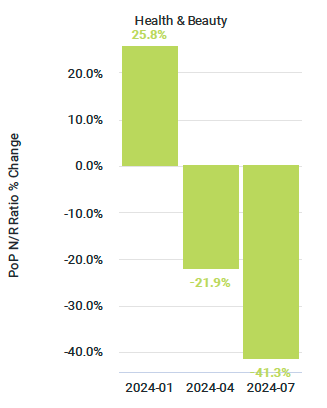
New/Returning Ratio - % Change
New Returning Ratio is measured as New Customers / Returning Customers, and changes compared quarter over quarter. A positive change means a shift to more new customers than returning customers compared to the previous period.
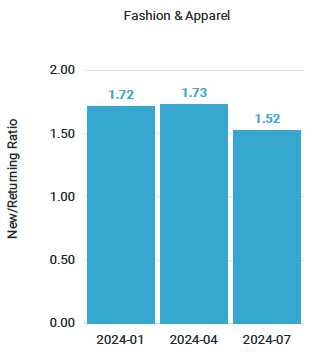
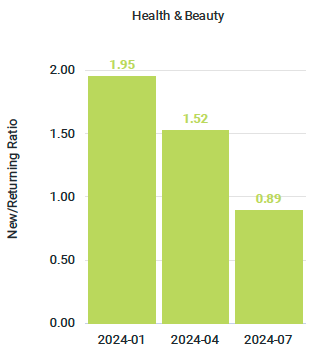
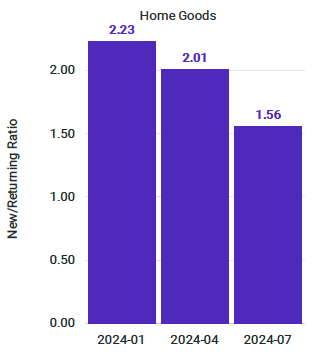
New/Returning Ratio
A New Returning Ratio of 1 means equal new and returning customers. A number less than 1 means more returning customers than new customers within the period. A number greater than 1 means more new customers than returning customers.
Findings by Industry
While we saw some overall trends from Q2 to Q3, such as decreases in revenue per customer, trends by industry are varied. Let’s take a look:
Industry
Average Order Value
Revenue Per Customer
Purchase Frequency
New / Returning Ratio
Fashion & Apparel
⬇️
⬇️
⬇️
More New
Food & Beverage
⬆️
⬇️
⬇️
More Returning
Health & Beauty
⬇️
⬇️
⬇️
More Returning
Home Goods
⬇️
⬇️
⬆️
More New
Contact us for more information, or to book a demo!